Summary
■ Younger generations prefer sweet tastes, and as we get older, our tolerance for bitter tastes increases.
■ Men tend to prefer “salty” tastes, while women tend to prefer “sour” tastes.
■ Hokkaido prefers “sweet” and “salty”, Shikoku prefers “umami”, and Kyushu and Okinawa prefer “sweet”, “salty”, and “bitter”.
■ Purchase data (repeat rate) also shows that product taste data and regional preferences match.
Taste & Aroma Strategic Research Institute Co., Ltd. (Headquarters: Chuo-ku, Tokyo; President and CEO: Michihiro Koyanagi; hereinafter referred to as ‘Taste & Aroma Strategic Research Institute’), conducted a survey on taste preferences targeting over 7,500 people nationwide in Japan. Using its proprietary taste preference diagnostic logic developed based on a taste database of over 120,000 food items, the Institute found that taste preferences vary by gender, age group, and region.
Taste & Aroma Strategic Research Institute is a next-generation food tech think tank company that utilizes taste big data and analysis techniques from around the world to quantify the ‘taste’ of food, expressing it in an easy-to-understand manner.
In this survey, conducted via web questionnaire with 7,691 men and women aged 15 to 79 in nine regions across Japan, we used the ‘taste preference diagnostic logic’ to confirm changes in taste preferences by age group, trends in taste preferences by gender, and differences in taste preferences among the nine regions.
Differences by age
The graph represents the balance of the five tastes (bitterness, umami, saltiness, sweetness, sourness). The thick gray line in the center represents the average value for all respondents, which serves as the criterion for judging taste preferences. Tastes outside the average are interpreted as preferred flavors, while tastes inside the average are interpreted as less preferred flavors.
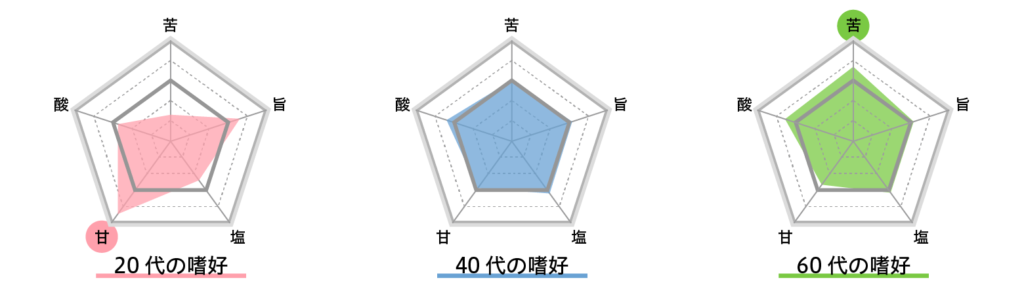
The data aggregated by age group from teenagers to people in their 70s revealed a clear change in trends regarding ‘sweetness’ and ‘bitterness’. In the younger age groups, from the teens to the twenties, the value for sweetness is high, but as people age, their preference for sweetness decreases.
On the contrary, there is a tendency among young people to avoid and reject bitterness, but it was shown that as they age, they begin to prefer it. Bitterness is said to be a signal of poison and is instinctively avoided, but this preference is acquired through food experiences. Sweetness, on the other hand, is instinctively preferred by people from an energy acquisition perspective, making it more appealing to relatively young generations. However, as people age and acquire a wide range of preferences through many food experiences, they tend to enjoy various flavors, leading to a relatively lower preference for sweetness. These trends are also closely related to “eating habits” and “familiarity,” and it is speculated that individuals in middle age and older have more opportunities to choose their daily meals based on their own preferences, which is a significant factor influencing taste preferences compared to younger generations.
When comparing the survey results between men and women, it was observed that in all age groups, men tend to prefer saltiness, while women tend to prefer sourness.
Regional differences
The survey conducted in nine regions across Japan revealed regional preferences. In Hokkaido and Tohoku, there is a tendency to prefer sweetness and saltiness, reflecting the characteristic of consuming salty preserved foods in these cold regions. Upon closer examination, it was found that in Tohoku, there is a higher prevalence of liking both sweetness and saltiness, while in Hokkaido, there are more patterns of strongly preferring sweetness alone or saltiness alone. This suggests that there are differences in preferred flavors in each region.
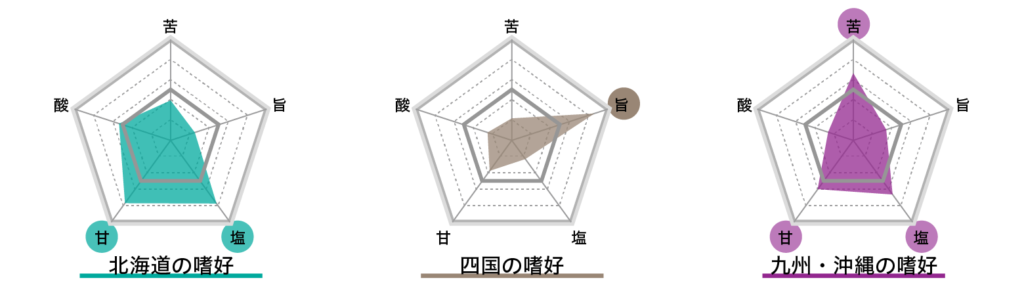
In western Japan, where there is a culture of using dashi (broth), there is a tendency to prefer umami flavors. In Kyushu, known for its sweet soy sauce, there is a preference for sweetness as well as a strong preference for intense flavors, including saltiness and bitterness.
Matching regional preferences and taste data
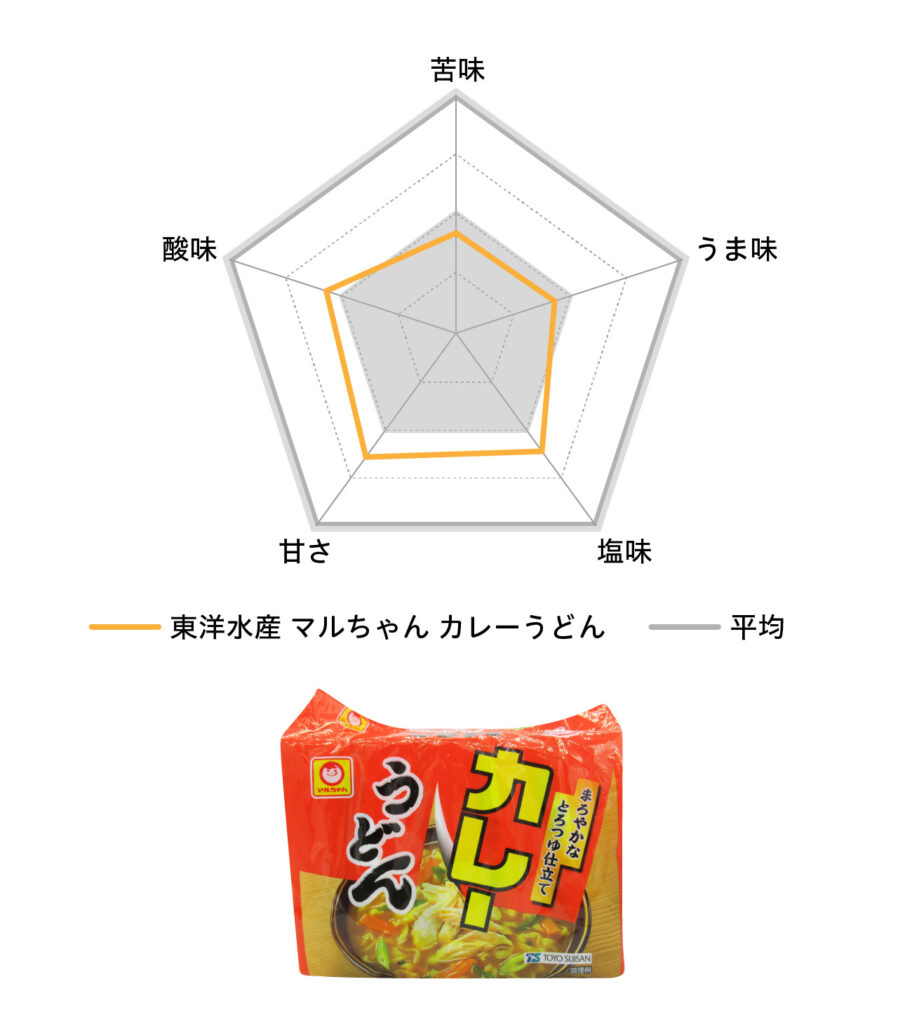
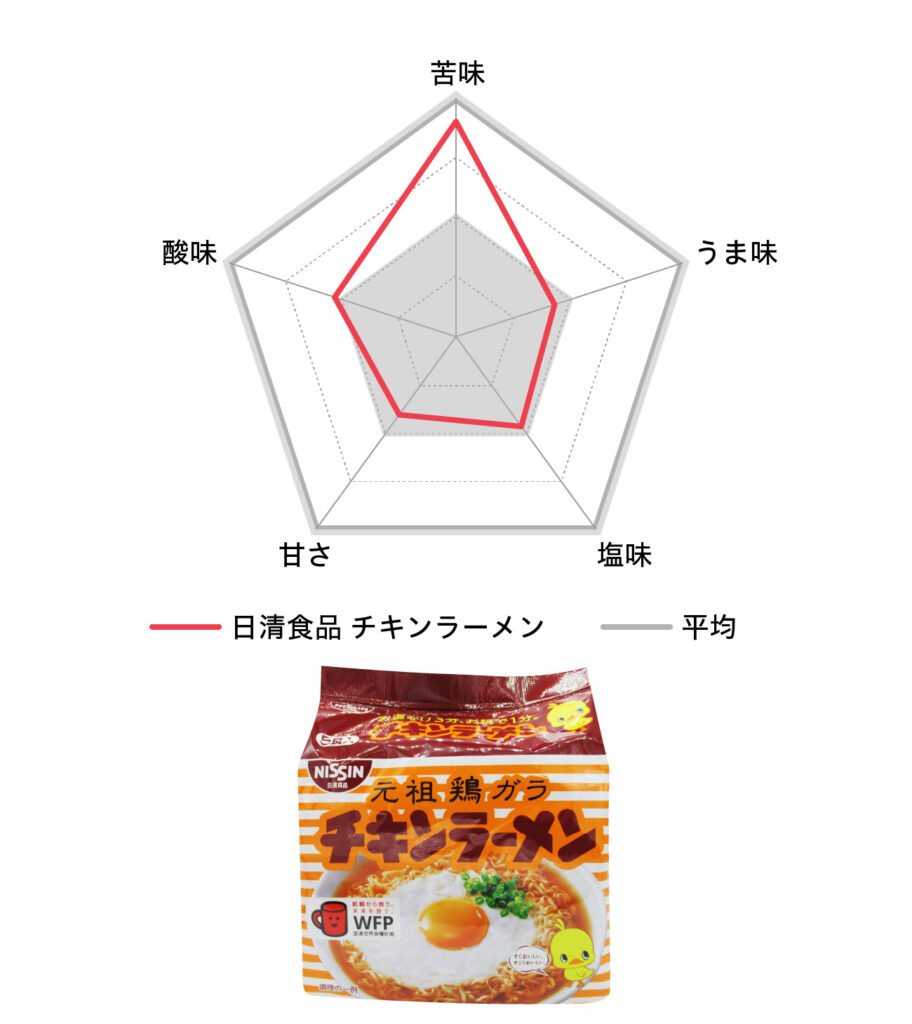
Figures 3 and 4 show the results of the analysis of bagged instant noodles using taste sensors (*2). Comparing this analysis with the taste preferences in each region, “Toyo Suisan Maruchan Curry Udon,” which has characteristics of sweetness and saltiness, seems to be suitable for the preferences of Hokkaido and Tohoku. On the other hand, “Nissin Chicken Ramen,” which is characterized by bitterness, is closer to the preferences of Kyushu and Okinawa.
To confirm these results, we used FOODATA (*3) to check the regional repeat purchase rates of both products using ID-POS (*4) and CVS-POS (*5) data from February 2022 to January 2023. (See Figures 5 and 6)
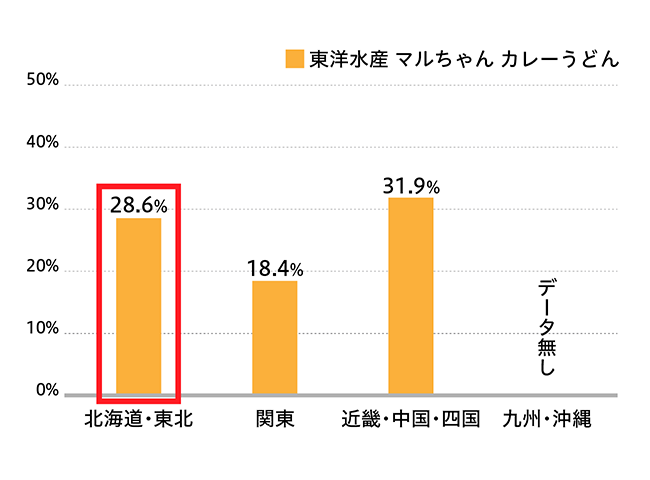
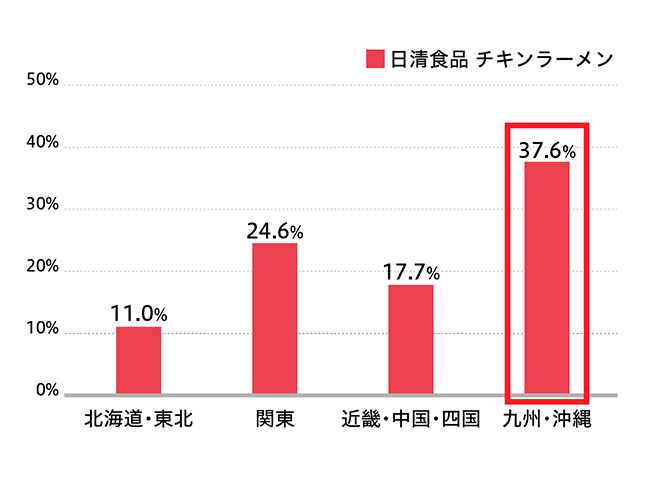
The repeat purchase rate of “Toyo Suisan Maruchan Curry Udon” was 28.6% in Hokkaido and Tohoku, the second highest rate after Kinki, Chugoku, and Shikoku. This rate is considered high compared to the udon culture in western Japan. “Nissin Chicken Ramen” stood out in Kyushu and Okinawa with a repeat purchase rate of 37.6%, higher than in other regions. While taste is not the only factor influencing these results, it can be said that these products have flavors that are easily accepted in each region.
In addition, taking the seasoning of fried chicken as an example, Zangi (fried chicken) eaten in Hokkaido is seasoned with strong saltiness and intense flavors, while in Kyushu, it is characterized by a sweet seasoning soaked in sweet soy sauce. In western Japan (Kinki, Chugoku, Shikoku), fried chicken is often seasoned with salt rather than soy sauce, and a simple seasoning that allows the umami of the meat to be felt is preferred. Even in the case of fried chicken, similar trends to regional taste preferences can be observed, and it is believed that taste preference data can be used in product development, such as local products.
Future prospects
While taste preferences by age group and region have been intuitively understood based on region-specific food cultures, our proprietary taste preference diagnostic logic now allows us to numerically demonstrate these differences. By combining taste data with our taste preference diagnostic logic, we can infer which age group and region would prefer a particular product’s taste. This can be used as reference data for selecting products when developing regional products or local projects.
Furthermore, knowing the individual taste patterns of consumers allows us to choose products that suit individual preferences, regardless of generation or region. This makes it a versatile tool as an important element in product recommendation functions.
While this study focused on Japan, we plan to reveal the taste patterns of people worldwide in the future. This will allow us to utilize the data for recommending Japanese food to international travelers and selecting products for export and import.
Taste & Aroma Strategic Research Institute plans to release web content in the future that can diagnose individual preferences. This will help raise awareness among consumers about the concept of patternizing preferences. Additionally, by collecting a large amount of preference data, we aim to improve the accuracy of our data.
■Annotation
※1 Taste Preference Diagnostic Program: A service that categorizes individual consumer taste preferences into five major groups and 22 specific patterns. This enables product development and recommendations based on taste preferences.
※2 SA402B or TS-5000Z, a taste recognition device manufactured by Intelligent Sensor Technology Inc., commonly known as a “taste sensor.” Figures 3 and 4 represent the measurement results analyzed using the taste recognition device SA402B.
※3 FOODATA is a DX support service for food product planning and development, developed through a business partnership between Flavor & Fragrance Strategy Research Institute, ITOCHU Corporation, and WingArc1st Inc.
※4 Analysis of FOODATA’s ID-POS product → Summary analysis of products (sales, indicators, purchasers)
※5 Analysis of FOODATA’s CVS-POS product → Summary analysis of products (sales, indicators, purchasers)
■Survey overview
Implementation date: December 2022
Method: Internet survey
Target: Ages 15 to 79 years old (13 segments in 5-year increments)
Gender: Male Female
Place of residence: 9 regions nationwide (Hokkaido, Tohoku, Tokyo metropolitan area, Hokuriku/Shinetsu, Tokai, Kinki, Chugoku, Shikoku, Kyushu/Okinawa)
Total: 7,691 people (equal number for each segment of age, gender, and place of residence)
About the Taste & Aroma Strategic Research Institute
Taste & Aroma Strategic Research Institute, a company that studies the science of food, utilizes visualization technology for the “deliciousness” of taste, aroma, texture, etc. This technology allows for the objectification of sensory values that were previously perceived through relative evaluation, enabling them to be used as evaluation criteria and scales. Since its establishment, the institute has continued to digitize food, and has built a taste database of over 120,000 food items. Based on this database, they provide food digital solution services that utilize data for various challenges related to food, such as food development, quality management, market research, and customization of taste for overseas markets.
Contact information
Email sales@mikaku.jp